This is a general implementation:
The MARLO BI module consists of a set of Dashboards* created to help users to analyze their information registered in MARLO (see images below). * Dashboard: a form of data visualization that offers a graphical view of indicators and data relevant to the activities related to one or more business processes.


- In the main menu bar, you will find the BI tab (1)
- The dashboards could be seen in a full-screen visualization by using the option on the top right side of the page (2)
- The information is updated every day at night (Colombian time) - (3)
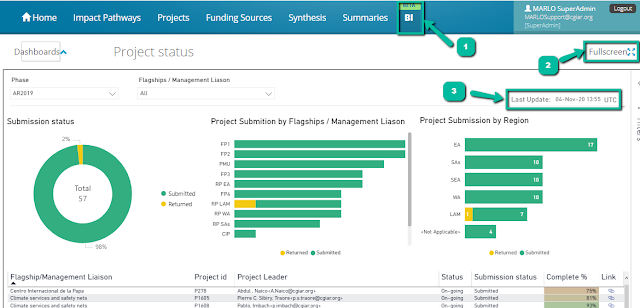
Project Submission
Here you can find the details
of the projects submission status and also the percentage of completeness
of each project depending on the required sections.

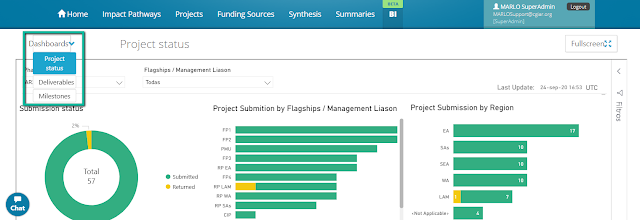
Deliverables Dashboard
You can see the information of each deliverable inputted in the system for a certain year. You will find information by product category, location, funding type, etc.
The list of deliverables is also located at the bottom of the page.

Milestones
You will find the information as per planned outcomes and milestones (in our impact pathways). It also shows the contribution on how projects are mapped to them and indicating achievements when the milestones have a target indicated.
With the Drill-through function (see point 2 below), you can see the detailed information.

Main Features
3) In the dashboard tables you can export the raw data.
4) the
tables have a link to MARLO to view the specific data (project, deliverable, etc.)
in the web application.

Comments
Post a Comment